19 Sep 2017
Josh
Exist survey 2017 results
Each year we've made a habit of asking users for their feedback on how we're going (here's last year's). This year's survey went out a bit late compared to previous years, as we really wanted to get custom tracking done first and give folks a bit of time to get a feel for it before asking what we should be doing next.
So without further ado, let's go through the survey questions and your responses. This year we received 217 responses. If you're not interested in individual questions, feel free to jump to the bottom where I'll summarise it and talk about how we'll be acting on your feedback.
How you use Exist
Do you have Exist installed on your phone?
- 70% iOS
- 24% Android
- 3% both iOS and Android
- 3% no app
Last year the results were:
- 55% iOS
- 34% Android
- 11% no app
Personally I'm disappointed to see the split widen towards iOS as I put a lot of work into the Android app! But it's good to see the proportion of people who don't have the mobile app has fallen.
How often do you open the mobile app?
- 47% open mobile app daily
- 23% a few times a week
- 20% once a week or less
- 10% basically never
We don't have an exactly equivalent question, but the results last year showed 33% of people looked at the Today tab in the mobile app at least once a week, and 23% looked at the Timeline tab at least once a week. So this year's result of 70% of people opening the app at least a few times a week seems to be an improvement, although this does also account for opening just to rate their mood and add tags — they might not look at anything else.
How often do you visit the Exist site?
- 10% visit the site daily
- 20% a few times a week
- 23% once a week
- 36% every few weeks
- 10% basically never
Again, we didn't have this exact question in last year's survey, but we found that 46% looked at the Today tab on the site at least once a week, compared to 53% who visited the site overall at least once a week this year. Given the questions don't match, I'd hazard that in general we haven't seen much of an increase here.
How often do you rate your mood?
- 41% daily
- 28% most days
- 24% occasionally
- 7% never
Last year, for the same question, 56% of respondents rated their mood at least most days, compared to 69% this year across those two answers. I'm happy to see this improvement as the more effort users put into this, the more we can tell them about what other things affect their happiness.
How often do you open the weekly progress email?
- 52% every week
- 31% most weeks
- 10% rarely
- 7% never
With 83% of respondents opening it at least most weeks, I'd consider the weekly email a success. This went through two redesigns in the last year so it was clearly worth the effort.
We didn't have an equivalent question last year.
What drew you to Exist initially?
I've paraphrased the free-form answers into groups of similar responses:
- Aggregation of data, wanted to track everything or wanted everything in one place
- Drawn by the correlations specifically
- The promise of insights into their data
- Was searching for something just like this
- Merlin Mann mentioned it
- Trying to understand specific issues like sleep
We've seen a big increase in users recently from Merlin's mentions of Exist across multiple podcast episodes, so thanks Merlin! It's nice to see that mostly these answers relate well to what we think Exist actually does — nobody answering this question really had the wrong idea about what they thought they would get.
What sort of related apps do you use?
Multiple selections were allowed.
- 50% habit tracker
- 49% lifelogging/journalling app
- 36% manual tracker app
- 34% visualisation app for making pretty graphs
- 24% spreadsheet
- 20% coaching app
- 12% mental or chronic illness app
Last year's results:
- 65% habit tracker
- 51% visualisation app
- 45% manual tracker
- 43% journalling app
I'd guess that the decline in other habit tracking apps is due to our introduction of custom tracking to Exist, which you can use as a habit tracker if you like. Otherwise, it's nice to see that fewer users this year need a separate app for visualising their runs or where they check-in.
New additions this year
Which of these features we've added in the last year have made Exist more useful for you?
Multiple selections were allowed.
- 73% custom tracking
- 46% new weekly email format
- 44% sleep from Apple Health
- 38% activity from Apple Health
- 34% food tracking from Apple Health
- 32% Gmail integration
- 29% Optimise page
- 28% Todoist
- 26% end of year email
- 23% Trends in Android
- 22% GitHub
- 11% Google Fit
- 9% Strava
Although the number is low in the list at 23%, Android users only make up 24% of users overall, so they clearly appreciated the new Trends tab (not yet in iOS).
Separately, it's exciting that custom tracking has had the huge impact we hoped it would, as it's a fair way in the lead within the results.
Combined, the Apple Health additions have made a big difference for users as well, which makes sense given our large proportion of users on iOS.
A large number of users wouldn't have received the end of year summary email because they signed up after January 1, which would explain its low ranking here. We had quite positive feedback about it at the time.
Finally, although we do continue to hear from users asking for specific activity and workout apps, it seems like we've now covered just about everyone with the current line-up, as only 19% of people feel they benefitted from us adding Google Fit and Strava. Because of this I am leery of spending time integrating Garmin — although conversely, with the death of Jawbone we will continue to see the value of the Jawbone UP integration decline, and we might want to replace that.
How often do you add tags about your day?
- 8% add custom tags multiple times a day
- 25% daily
- 23% most days
- 19% occasionally
- 25% never
These are great results for something we launched so recently. And to spoil the next question's responses a bit, 23% of users haven't tried custom tracking at all yet, which accounts for most of the "never" response.
How useful do you find custom tracking?
- 45% useful and worth doing consistently
- 27% useful and hard to do consistently
- 23% haven't tried yet
- 5% not worth the effort
- 1 person said it's not useful at all
Sorry to that one person.
Again, it's great to see such a positive response this early on. I hope these numbers increase by next year as users get a better idea of how to use custom tracking and see more correlations from their tags.
What sort of things are you tracking with custom tags?
Multiple selections were allowed.
- 78% activities you did
- 55% habits
- 55% illness symptoms
- 46% feelings/qualitative measures
- 44% events
- 41% food and drink
- 25% people seen
- 22% medications and supplements
- 16% specific places visited
Mostly people are using custom tracking as a sort of "habit tracker plus" with their set habits plus other activities. It's good to see that feelings and symptoms are also high, though, as we had hoped that custom tracking would let users track other personal qualitative measures like anxiety, stress, and pain in a useful way.
Any other comments on custom tracking?
I've paraphrased the free-form answers into groups of similar responses:
- It's great
- I want to be able to edit tags
- I want to be able to add multiples of tags
- I want to be able to add numeric values to them
- I want tag suggestions or list of most popular tags across users
- I haven't seen any value yet
- How do I delete tags?
Thank you to everyone who left a positive message! To everyone asking for more stuff: sheesh, we only just built the whole thing, settle down back there. We do have plans to remove the tag limit for each day, allow you to edit tag names, and add some more tag suggestions. We're also thinking about the best way to handle multiple values for tags, for example "coffee (2)", but — spoiler alert — when it came down to it, you'd rather we worked on other stuff first.
Oh and hey, you can delete tags from the attributes page. This'll make it into the mobile apps eventually.
Correlations and data
Do you usually visit the Exist site looking for particular information, or with a particular question in mind that you want to answer?
I've paraphrased the free-form answers into groups of similar responses:
- No
- Curiosity or looking to be told something interesting
- Looking at a specific attribute's correlations
- Looking at correlations in general
- Just having a browse
Before creating this year's survey we posited that people mostly visited to check a particular thing, like "how is my sleep going, anyway?" It turns out that mostly this is not the case. Given so many people just visit to be shown something new, we definitely need to get better at bringing more new and relevant data to you without making you go digging.
Is there a particular thing you're tracking in Exist that you're trying to improve?
Multiple selections were allowed.
- 60% productivity
- 57% mood
- 54% sleep
- 46% activity level
- 39% weight
- "Other" included a lot of chronic and mental health symptoms
I am surprised that productivity is so high, but I guess we all struggle with motivation and being as productive as is needed. Perhaps this is a symptom of a larger problem, and we should bring down this whole system of trading our labour for income...? Never mind, just a crazy idea. Also, we see a lot of users find us from RescueTime, a productivity tracker, so in retrospect this number makes sense.
Is there anything more Exist could do to help you with improving that?
I've paraphrased the free-form answers into groups of similar responses:
- Add this specific integration
- Give me tips based on correlations or let other users suggest ideas
- Let me try experiments and see if they help or not
- Time of day breakdowns
- More nudges to rate day/add tags
- Numeric values on tags
This was a badly worded question that people didn't really know how to answer. My fault. Respondents mostly suggested new features that also came up in other places in the survey.
Letting you set up a specific experiment along the lines of "I want to improve X, does doing Y help?" is something we've been thinking about too that seems like a good idea.
How could we make correlations more useful for you?
Multiple selections were allowed.
- 70% let me rate correlations as useful or not
- 68% correlations on longer time periods, or across previous days
- 55% correlations across multiple attributes at once
- 44% hide more obvious correlations
- 40% expand Optimise to more attributes
- 34% show me correlations more often in relevant places
- 22% let me annotate correlations
- 21% more correlation descriptions
- "Other" paraphrased: let me track experiments, let me sort by strength and confidence
I'm disappointed that the descriptions came last, as I thought these were a help in understanding why you have that specific correlation, what it could mean to you, and whether science backs it up.
Our long-standing worry is that many correlations that initially seem far-fetched or between unrelated attributes have a valid reason that would be revealed if only users stopped and thought about it. Descriptions were a way to try and do the thinking for you in advance (and they took a huge amount of time to write, thank-you-very-much). To have the biggest impact, most correlations that received descriptions were those that are very common, so perhaps the descriptions mostly feel superfluous as the meaning is already clear. Oh well.
As part of our upcoming redesign we'll definitely be letting users rate correlations up or down, and using this to tailor what correlations to show in future. We'll also hide correlations for everyone that get above a certain threshold of "not useful" ratings.
Correlations across longer time periods will make more sense for things like weight, that change over the long-term, and correlations across two days (ie. "did this thing yesterday affect this other thing today?") will help show cause and effect that doesn't occur on the same day.
Any other feedback on correlations?
I've paraphrased the free-form answers into groups of similar responses:
- Correlations are not always useful
- Sometimes they are too obvious
- Sometimes they're just funny
- I don't understand some that seem far-fetched
- They're the best part of Exist
- I want to see correlations across longer periods
- I want to see them in more places, especially mobile apps
- I want to be able to vote them up or down to tailor what I'm shown
I've addressed a lot of this on the previous question, but it's clear that respondents both think correlations are powerful, and are disappointed they don't get more useful results. Previously we worried that users wouldn't receive enough correlations, but now we have more integrations, and custom tags, the problem is inverted — most people have too many. We'll first work on filtering out irrelevant correlations, and letting you do the same, then work on other ways to both unearth interesting results and to present them in a way that is understandable.
Last year's survey also showed that people wanted their correlations to be more immediately useful and understandable, so this is an issue we still haven't fixed.
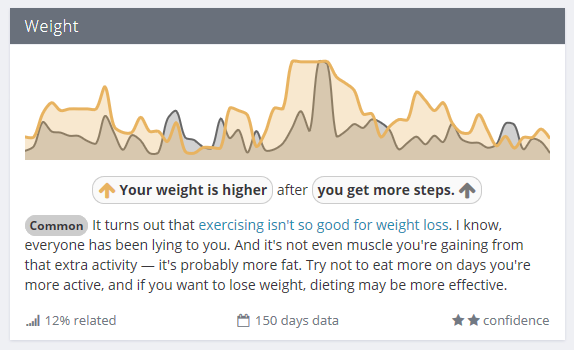
Also, more than a few people rolled out Merlin Mann's favourite example of "you get more steps when you work out more" as an example of too-obvious correlations. You'll all be relieved to know that this specific result was already hidden a while ago.
Looking forward
Is there anything more we could do to be more transparent about Exist and what we're working on?
I've paraphrased the free-form answers into groups of similar responses:
- No, you're very transparent
- You're great at transparency and communicating with users
- More blog posts, more podcast eps please
- Optional digest emails on what's happening on the roadmap overall
- Add a forum
Thank you to everyone who left nice feedback here! We'd like to think we're doing a lot to be open about what we're working on, what our plans are, and what's possible with a team of two, but without asking one can never be sure. However, you've encouraged us to keep being open, so I thank you. Your answers are partly why I'm going through this survey question by question and not just writing a brief summary ;)
One of the major downsides of being transparent is that it gives angry users a larger attack surface. Keeping everything to ourselves would mean someone angry at our progress could say, "You don't seem to be doing this thing! What are you even doing in there?!" But being transparent allows naysayers to use the specifics against us, and complain that we only completed one thing last month, or we moved a particular suggestion to planned instead of the one they wanted.
Because of our roadmap and user suggestions, it's very obvious to everyone how much people ask for compared to what we find time to do.
Still, we believe the best way to handle this is to be open about our size and our huge list of priorities to juggle. We're not pretending to have any more resources than we do, or move faster than we are — it's all there up-front to scrutinise. So I'm glad it's appreciated.
Also, as one respondent mentioned, quite shrewdly, the more time we spend on blog posts, the less time we have to code new stuff! Still, with Belle finally joining Hello Code full-time as of October, we will hopefully find more time to blog and podcast more often.
A few people have asked for a forum where users can chat and developers can discuss our API and share their integrations, etc. What would be the best place for this?
- 33% don't care and wouldn't use
- 32% self-hosted forum
- 20% subreddit
- 6% Facebook group
- "Other" included lots of other random suggestions
With two-thirds of respondents having an opinion and potentially looking to use a forum, we'll be adding something of our own sometime soon. Discourse seems nice, so we might go with that.
If we could only focus on one thing for the next year, what should it be?
- 26% better correlations
- 19% more integrations
- 18% add more to the mobile apps
- 16% custom tracking additions like numeric values
- 12% add multiple values per day
- 9% better historical data access
There was no clear winner here, and the totals fluctuated quite a lot as respondents filled out the survey. Still, working on better correlations is slightly ahead of the pack, so that's definitely something we'll prioritise. This doesn't mean we won't keep adding integrations and working on the mobile apps, but our top priority will be correlations.
As mentioned earlier, we've already planned a redesign for the site that'll group data more logically, give you tools for rating correlations, and make it easier to look at historical data and totals for different periods. Unfortunately that last one isn't particularly popular! I doubt anyone will complain if I include as part of the redevelopment anyway.
Last year 30% of respondents wanted smarter and more useful correlations, which we partly delivered on with Optimise, correlation descriptions, and indicators of how common each is. 26% of users wanted more subjective data tracking, which we delivered on with custom tracking.
What sort of data should we prioritise when adding new integrations?
- 22% productivity
- 20% Zapier or IFTTT integration
- 17% everything from Apple Health
- 17% health data
- 14% media data
- 8% finance
- 2% social media
Productivity wins again! This is in contrast to votes on the roadmap, where Facebook (social media), Mint (finance), and Pocket (media) are most voted for. Who to trust?
We've already planned to add Facebook, so that'll happen, but next we'll prioritise productivity-related data like multiple Gmail accounts and perhaps Trello or Toggl, both highly voted. We've already begun preliminary work to get Exist to play nicely with IFTTT Maker Channel, so we'll also explore that further. Some planned API updates to let services add a tag will enhance this combo too, as you can set up IFTTT triggers to add a tag like "coffee" or "meeting".
Last year 39% of respondents wanted custom tracking, which we delivered. Yay!
How disappointed would you be if Exist no longer existed?
You know, the answers to this one are more useful for us than for you, but in the interests of transparency:
- 71% picked 7/10 or above
- 28% picked 6/10 or lower
- 1 person picked 1/10
To that one person: again, I am sorry.
Have you recommended Exist to anyone else? How did you describe what it does?
I've paraphrased the free-form answers into groups of similar responses:
- A way of aggregating stuff and finding more useful info
- Put to use all the data you already make
- Helps you find correlations
- Quantified Self tool (lots of responses mentioning QS specifically)
- Yes I recommend it to therapists and doctors (nice!)
- I use it as an example of how to find value in third-party APIs
- No, I don't know anyone who would care
- No, I didn't think to but I will now (thanks!)
- Yes but nobody wants to try without a free plan
The main takeaway from this one is that folks have a decent understanding of the value of Exist and know how to describe it! A lovely result, and thank you to everyone who has spread the word. We still hear from new users who say "I only just came across you, but I wanted to build something like this" or "I've been looking for something like this for ages" so word of mouth is a big help in reaching folks who might want Exist but not know that it, well, exists.
Any final feedback, compliments, or complaints?
I've paraphrased the free-form answers into groups of similar responses:
- Thanks! You're doing great, keep on going
- Good job making this better during the last year
- Please improve the iOS app or make these specific changes
- Please add this specific thing
Thank you, everyone who completed the survey and helped shape our plans for the next year.
In summary
I largely addressed how we'll be acting on the survey results with each individual question, but in the interests of TL;DR-ing I'll summarise it again here.
Custom tags: We have plans to remove the tag limit for each day, allow you to edit tag names, and add some more tag suggestions.
Correlations and data: We definitely need to get better at bringing more new and relevant data to you without making you go digging. Letting you set up a specific experiment along the lines of "I want to improve X, does doing Y help?" is something we've been thinking about too. As part of our upcoming redesign we'll be letting users rate correlations up or down, and using this to tailor what correlations to show in future. We'll first work on filtering out irrelevant correlations, and letting you do the same, then work on other ways to both unearth interesting results and to present them in a way that is understandable.
New stuff: We'll add a forum for users and developers. Working on better correlations is most popular, so that's something we'll prioritise. This doesn't mean we won't keep adding integrations and working on the mobile apps, but our top priority will be correlations. We've already planned to add Facebook, so that'll happen, but next we'll integrate new productivity-related data. We've already begun preliminary work to get Exist to play nicely with IFTTT Maker Channel, so we'll also explore that further. We're planning a redesign of the web site that'll go together with the correlation updates and make it easier to find more useful data.
Thanks again to everyone who responded. See you on the roadmap and the upcoming forum!